Tag Archives: open source

AvMet Beta Release – STRATUX Database Reporter Project (open source!)

AvMet Beta Available on GitHub


For that last 6 months I have been capturing Aviation Mode-S and ADS-b data transmissions using my own customizd STRATUX Aviation Traffic Receiver running Raspberry Pi 3b. With my modifications, the device automatically shuts down daily for a few seconds to release the current SQLite3 database, and the start up pointing at a fresh database. Once released, the database is compressed to save space and for later download (I use rsync to automate that as well).

These database files can be very big, and contain hundreds of thousands of contact events each day. When these databases are generated every day, it doesn’t take long to get a backlog of them to examine for interesting things, such as NASA aircraft and some mysterious high-flyers using spoofed identities.

Being a professional programmer and data guru, this seemed like a perfect project to open-source and use a marketing tool for my consulting. After a week of design, development and preliminary tests.. it’s ready for comment.

What it does:


The tool is purpose built for my needs, so it might not (yet) be easily used on your own Stratux database files, but I feel I’ve made a reasonable effort in the interests of ease.

Each database file is opened and checked for a number of conditions and data:

  • Verify database contains expected STRATUX data tables.
  • Select first timestamp record and report it out. Since the name of the file might not be self descriptive, this is really helpful to know the dataset’s start time:
    Using Database File: './sqlite-stratux-temp'
    	Start: 2017-10-10 08:11:09.967 +0000 UTC
    	-----------------------------------------
    
  • Check dataset for obvious duplicates and remove them. It’s not uncommon for the message log to repeat a fixed position up to 5 times. Although this does not affect the current metrics, this bloats the dataset. There is an optional flag to disable this feature
  • Once duplicates are removed, each airframes dataset is checked for gross errors, such as changes in altitude or speed that would be possible only with alien spacecraft; records are also removed. There is an optional flag to disable this feature
      10486213 -- Bad Distance  	   24924 --> 51857   
      10617769 -- Bad Distance  	   82039 --> 206496  
      10707621 -- Bad Speed              318 --> 8303
    
  • Following data repair a few metrics are pulled from the dataset, looking for interesting boundary events such as Fastest and Furthest contacts. Each record reports the Callsign or Tail Registration number (when available), and the Mode-S ICAO24 code as well as altitude, speed and distance for the specific event. Example:
    	  FASTEST:   XAOLE [0D0AAE]   43000 ft.  @   529 kts.      23 mi.
    	  SLOWEST:   NDU45 [A6EBAF]    1150 ft.  @    61 kts.    2.26 mi.
    	  HIGHEST:   XAOLE [0D0AAE]   47025 ft.  @   505 kts.      92 mi.
    	   LOWEST:  N41218 [A4DE2A]     550 ft.  @    77 kts.    1.71 mi.
    	  CLOSEST:  N6464R [A87E79]    2525 ft.  @    84 kts.    0.00 mi.
    	 FURTHEST:  N229NN [A203A9]   36000 ft.  @   472 kts.     128 mi.
    

    Here is an example of an interesting contact captured last year along the coast of California; a high-altitude signal from a NASA 747 test aircraft almost 100 miles off the coast.

    	  HIGHEST: NASA747 [AA0DB8]   43025 ft.  @   473 kts.      32 mi.
    	 FURTHEST: NASA747 [AA0DB8]   43000 ft.  @   466 kts.      92 mi.
    
  • During this phase of the process, special Squawk Code events are trapped that might indicate special civil, science or military operations. Example:
    	**ALERT:  N7253N [A9B8ED] 4403     2500 ft.  @   118 kts.  SR-71, YF-12, U-2 and B-57, pressure suit flights
    	**ALERT:  N7272N [A9C038] 4402     2075 ft.  @   116 kts.  SR-71, YF-12, U-2 and B-57, pressure suit flights
    	**ALERT:  N7274N [A9C07E] 4404     1250 ft.  @   100 kts.  SR-71, YF-12, U-2 and B-57, pressure suit flights
    	**ALERT:  N907CH [AC8967] 4442     1800 ft.  @   140 kts.  SR-71, YF-12, U-2 and B-57, pressure suit flights
    

    In the above case, N7253N, N7272N and N7274N are Department of Homeland Security Border Patrol helicopter contacts.

Here is a recent report example:

        Start: 2017-10-10 08:11:09.967 +0000 UTC
        -----------------------------------------
          FASTEST: AFR6721 [3951C1]   32975 ft.  @   531 kts.      14 mi.
          SLOWEST:  N42894 [A51D07]     950 ft.  @    51 kts.    3.21 mi.
          HIGHEST:    JCB1 [43E9D5]   47025 ft.  @   469 kts.      34 mi.
           LOWEST:  N724DP [A9B2C1]     400 ft.  @    72 kts.    1.65 mi.
          CLOSEST:  N605CH [A7DA0C]   16200 ft.  @   400 kts.    0.02 mi.
         FURTHEST:  N9023N [AC7968]   33050 ft.  @   433 kts.     143 mi.

Where can you get it?

You can fork or pull the current source code from GitHub here: IngeniiCode AvMet

Cassandra – Getting Started – (deployment Part 2 – Installing Ops Center)

<< Previous: Cassandra – Going into Production – Part 2.

With an empty cluster running, the next step I’m going to take is to install and configure OpsCenter from DataStax. This is a fantastic tool for monitoring the health and performance of your cluster.

Installing Ops Center

The first order of business is to create a directory to store the Ops Center code on the server. I opted to do this within the user account used for Cassandra, as the directory datastax

:~$ mkdir datastax
:~$ 

Next, download and extract the OpsCenter package:

:~/datastax$ wget http://downloads.datastax.com/community/opscenter-1.4-free.tar.gz
--2012-03-26 08:25:30--  http://downloads.datastax.com/community/opscenter-1.4-free.tar.gz
Resolving downloads.datastax.com... 173.203.57.192
Connecting to downloads.datastax.com|173.203.57.192|:80... connected.
HTTP request sent, awaiting response... 200 OK
Length: 21539843 (21M) [application/octet-stream]
Saving to: `opscenter-1.4-free.tar.gz'

100%[=======================================================================>] 21,539,843  3.72M/s   in 7.5s    

2012-03-26 08:25:38 (2.74 MB/s) - `opscenter-1.4-free.tar.gz' saved [21539843/21539843]

:~/datastax$ tar -xvzf opscenter-1.4-free.tar.gz
opscenter-1.4/
opscenter-1.4/log/
opscenter-1.4/bin/
opscenter-1.4/bin/create-keystore.bat
opscenter-1.4/bin/create-key-pair.bat
[...]
opscenter-1.4/conf/event-plugins/email.conf
opscenter-1.4/conf/ssl.conf
opscenter-1.4/conf/opscenterd.conf

:~/datastax$

Next is the setup for OpsCenter. Setup is done via a Python script, located in the BIN directory. Have your listening IP ready and know which port you want to use for the Ops Center web portal. I’m going to use the default of port 8888. Make sure you have the port open on your machine. (click here to jump to the my section on ports).

:~/datastax$ ls
opscenter-1.4  opscenter-1.4-free.tar.gz
:~/datastax$ cd opscenter-1.4
:~/datastax/opscenter-1.4$ bin/setup.py
Generating a 1024 bit RSA private key
.........++++++
...++++++
writing new private key to 'ssl/opscenter.key'
-----
MAC verified OK
Certificate was added to keystore

:~/datastax/opscenter-1.4$ 

Configure the Ops Center deamon. Set the listening IP to an IP available on the system. I’m going to node’s interal IP address (10.1.0.23). The values I’ve changed are in bold.

:~/datastax/opscenter-1.4$ vi conf/opscenterd.conf
[...]
[jmx]
# The default jmx port for Cassandra >= 0.8.0 is 7199.  If you are using
# Cassandra 0.7.*, the default is 8080, and you should change this to
# reflect that.
port = 8001
[...] 
[webserver]
port = 8888
interface = 10.1.0.23
staticdir = ./content
log_path = ./log/http.log
[...]
[cassandra]
# a comma-separated list of places to try for a connection to your Cassandra
# cluster:
seed_hosts = 10.1.0.23,10.1.0.26
[...]

Installing the Ops Center Agents

Each node in the cluster must have a running Ops Center agent. The installation package for this was generated by the Ops Center setup process, and saves a compressed file. This file then needs to be copied and extracted on each node you plan to monitor with the Ops Center.

:~/datastax$ mkdir opscenter-agent
:~/datastax$ cp opscenter-1.4/agent.tar.gz opscenter-agent/
:~/datastax$ cd opscenter-agent/
:~/datastax/opscenter-agent$ tar -xvzf agent.tar.gz
agent/opscenter-agent-2.5-standalone.jar
agent/conf/log4j.properties
agent/bin/setup.bat
[...]
agent/bin/ssl/agentKeyStore.p12
agent/bin/ssl/opscenter.key
agent/doc/LICENSE

:~/datastax/opscenter-agent$

Now run the agent’s setup, assigning it’s IP and the Ops Center’s IP. 10.1.0.26 is this node’s IP address. 10.1.0.23 is the location of the Ops Center install (this may or may not be on the same system or even the same IP address):

:~/datastax/opscenter-agent$ agent/bin/setup 10.1.0.26 10.1.0.23

Make sure you copy the agent file to ALL your other nodes and follow the same setup procedure (this is an example of how I copied the file, your system, ports etc. may be different), and repeat the steps above, with the appropriate IPs.

:~/datastax/opscenter-agent$ scp -P41718 agent.tar.gz bigdata@10.1.0.26:.
RSA key fingerprint is 2b:5b:26:03:87:a4:b1:ea:90:b5:4e:42:60:88:cd:d1.
bigdata@10.1.0.26's password: 
agent.tar.gz                                                                   100%   10MB  10.3MB/s   00:01    
:~/datastax/opscenter-agent$ 

Start up Ops Center

On the Ops Center machine, move back to it’s installed directory and start the process.

:~/datastax$ cd opscenter-1.4
~/datastax/opscenter-1.4$ bin/opscenter &

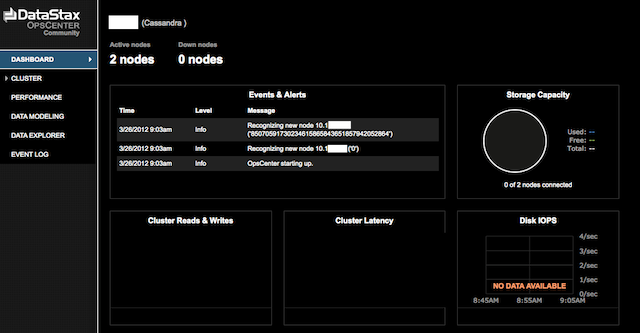
Now connect to the IP address and port and you should see a base Ops Center instance. This is what you would typically see before starting up your agents:

DataStax Ops Center 1.4

Start up the Node Agents

The last step is to start up the Agent deamons so that the OpsCenter knows the status of each node.

:~/datastax/opscenter-1.4$ cd ../opscenter-agent/
:~/datastax/opscenter-agent$ agent/bin/opscenter-agent &
:~/datastax/opscenter-agent$  INFO [main] 2012-03-26 09:12:40,465 Loading conf files: conf/address.yaml
 INFO [main] 2012-03-26 09:12:40,505 Java vendor/version: Java HotSpot(TM) 64-Bit Server VM/1.7.0_03
 INFO [main] 2012-03-26 09:12:40,505 Waiting for the config from OpsCenter
 INFO [main] 2012-03-26 09:12:40,637 SSL communication is enabled
 INFO [main] 2012-03-26 09:12:40,637 Creating stomp connection to 10.1.0.23:61620

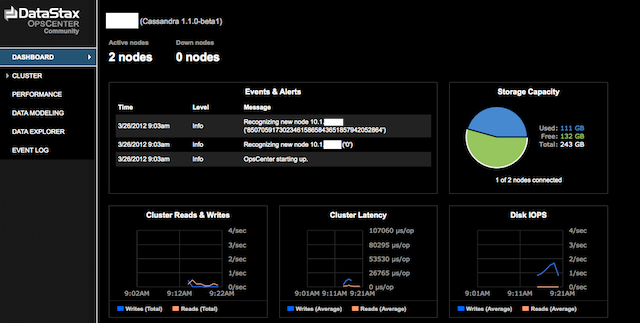
With the Agents fired up, you will see a nice dashboard, showing the current status of the cluster, and some metrics on performance.

Ops Center up and running.

Conclusion

This basically concludes the fast deployment steps required to download, install, configure and start up Cassandra, along with the DataStax Ops Center.

Total time required to deploy was under 4 hours.

Cassandra – Getting Started – (deployment Part 1 – Installing Cassandra)

It’s been almost a month since I started the Apache Cassandra investigation, and now it’s time to move into a production stance. Some of these steps will differ from the original steps documented here in my blog. Later this week I will go back and amend those posts to point at this post as the more recent information. Those old links are already being referenced by multiple sites, so deleting them would not be a kind thing to do. Thus.. onward we move!

Getting the right JVM/JDK/JRE

Originally, the OpenJDK was being used for this introduction and research into Cassandra. Being a proponent of Open Source, I was going to avoid the use of Oracle’s potentially proprietary JDK/JRE in this environment. I have since seen first had, that the JDK DOES IN FACT MATTER, and the one that supports the latest tools is the one from Oracle.

That is located here:

Downloading the JRE/JDK from Oracle has enabled the reliable use of DataStax’s OpsCenter management tool (more on that later).

These are the recommended minimums for Cassandra and OpsCenter from DataStax, a respected partner of the Apache Cassandra project.

Sun Java Runtime Environment 1.6.0_19 or later
Python 2.5, 2.6, or 2.7
OpenSSL version listed in Configuring SSL unless you disable SSL

I ended up selecting the JDK (linked here) and deposited it in the following location on my system as user root (create the directory path if you don’t already have it):

/opt/java/64/jdk-7u3-linux-x64.tar.gz

Extract the file:

:/opt/java/64# tar -xvzf jdk-7u3-linux-x64.tar.gz
jdk1.7.0_03/
jdk1.7.0_03/include/
jdk1.7.0_03/include/jvmti.h
jdk1.7.0_03/include/jawt.h
[...]
jdk1.7.0_03/jre/plugin/desktop/sun_java.desktop
jdk1.7.0_03/jre/COPYRIGHT
jdk1.7.0_03/LICENSE
jdk1.7.0_03/COPYRIGHT
:/opt/java/64# 

The Cassandra Build I decided to use is this one: apache-cassandra-1.1.0-beta1. I downloaded the file to the user I created for this using wget:

:~$ wget http://apache.deathculture.net/cassandra/1.1.0/apache-cassandra-1.1.0-beta1-bin.tar.gz
--2012-03-25 22:52:27--  http://apache.deathculture.net/cassandra/1.1.0/apache-cassandra-1.1.0-beta1-bin.tar.gz
Resolving apache.deathculture.net... 173.236.158.254
Connecting to apache.deathculture.net|173.236.158.254|:80... connected.
HTTP request sent, awaiting response... 200 OK
Length: 12505037 (12M) [application/x-gzip]
Saving to: `apache-cassandra-1.1.0-beta1-bin.tar.gz'

100%[=======================================================================>] 12,505,037  8.84M/s   in 1.3s    

2012-03-25 22:52:29 (8.84 MB/s) - `apache-cassandra-1.1.0-beta1-bin.tar.gz' saved [12505037/12505037]

Next the file is extracted, moved to a shorter directory name:

:~$ tar -xvzf apache-cassandra-1.1.0-beta1-bin.tar.gz
:~$ mv apache-cassandra-1.1.0-beta1 cass-beta1

Configuring a Node

Now the configuration is edited to define the node ring. The first file to edit is the cassandra.yaml file.

This initially will be only a 2 node cluster, but the tokens must still be calculated. Here are the node tokens I generated using a PERL script I wrote (see: Cassandra and Big Data – building a single-node “cluster” – Extra Credit for the code):

:~/cass-beta1$ ./token.pl 2
Calculate tokens for 2 nodes
factor = 170141183460469231731687303715884105728
node 0	token: 0
node 1	token: 85070591730234615865843651857942052864
:~/cass-beta1$ 

Edit the cluster name. I’m not testing, so I changed the name to one descriptive of the data I was storing. ‘ip’. In the example below, I’m showing configs for the 2nd of the two nodes. Note: The first node would have a different IP address and also a different initial token, in this case ‘0’, as calculated by the tool.

:~$ cd cass-beta1/
:~/cass-beta1$ vi conf/cassandra.yaml

[...]

# The name of the cluster. This is mainly used to prevent machines in
# one logical cluster from joining another.
cluster_name: 'ip'

[...]

 If blank, Cassandra will request a token bisecting the range of
# the heaviest-loaded existing node.  If there is no load information
# available, such as is the case with a new cluster, it will pick
# a random token, which will lead to hot spots.
initial_token: 85070591730234615865843651857942052864

[...]

# directories where Cassandra should store data on disk.
data_file_directories:
    - /home/bigdata/data/

[...]

# commit log
commitlog_directory: /home/bigdata/commitlog/

[...]

# saved caches
saved_caches_directory: /home/bigdata/saved_caches/

[...]

          # seeds is actually a comma-delimited list of addresses.
          # Ex: ",,"
          - seeds: "10.1.100.101,10.1.100.102"
[...]

# Setting this to 0.0.0.0 is always wrong.
listen_address: 10.1.1.101

[...]

rpc_address: 10.1.1.101

[...]

# Time to wait for a reply from other nodes before failing the command (this was done to increase timeout to 30 seconds, sometimes the search I need to run is pretty nasty)
rpc_timeout_in_ms: 30000

Following that, the shell file needs to be modified to designate the JMX listening port:

:~/cass-beta1$ vi conf/cassandra-env.sh

[...]

# Specifies the default port over which Cassandra will be available for
# JMX connections.
JMX_PORT="8001"

[...]

Make sure your logfile is in the desired location. I decided to keep it within the account itself for now:

vi cassA-1.0.8/conf/log4j-server.properties
[...]

log4j.appender.R.File=/home/bigdata/log/cassA.log

[...]

Next I set the paths in the .bash configuration file for the account, using the following 3 environment variables (ANT_HOME is used by the ANT compiler, if you are not writing code, your JAVA_HOME will point at the JRE, not the JDK, and you won’t need the ANT_HOME path at all):

vi ~/.bash_profile
export JAVA_HOME=/opt/java/64/jdk1.7.0_03
export ANT_HOME=/usr/lib/ant/
export CASS_BIN=$HOME/cass-beta1/bin
export PATH=$PATH:$ANT_HOME/bin:$CASS_BIN

Systems Administration

Make sure there is a location for the cassandra server to write it’s log files. You’ll need your SysAdmin, or root privs, to do this. I set the ownership to root and the user under which I’m currently running cassandra (bigdata):

root:/data/feed/indata# cd /var/log
root:/var/log# mkdir cassandra
root:/var/log# chown root:bigdata cassandra
root:/var/log# chmod 775 cassandra

The following ports need to be opened up, if you are running a firewall on each system (you ARE, right!?!), to allow Cassandra nodes to communicate with each other. This is a snippet from my rules-based firewall control file.


Port Usage:

  • 9160 – Thrift port, where the API is serviced for Reads/Writes to Cassandra
  • 8001 – Individual node listening port. This is used for the command line (cli)
  • 7000 – Commands and Data TCP port, used nodes for communications
  • 7001 – SSL port used for storage communications
  • 8888 – Only used on systems that will host an Ops Center installation
  • 61620 – Required for Ops Center Agent Communications

## Cassandra
ACCEPT          loc             $FW             tcp     9160,8001,7000,7001
## OpsCenter
ACCEPT          loc             $FW             tcp     8888,61620


Starting up the Cluster

This is where the truth is told. The rubber meets the road. The money is placed where your mouth is. Light ’em up!

:~$ cassandra
:~$  INFO 23:52:54,232 Logging initialized
 INFO 23:52:54,236 JVM vendor/version: Java HotSpot(TM) 64-Bit Server VM/1.7.0_03
 INFO 23:52:54,237 Heap size: 6291456000/6291456000
[...]
INFO 23:52:55,162 Node /10.1.0.23 state jump to normal
 INFO 23:52:55,163 Bootstrap/Replace/Move completed! Now serving reads.

IT LIVES!! Now start your other node(s), and check to verify you have a complete ring, properly configured. You should see something like this in subsequent nodes, I’ve highlighted the references to the other member node:

[...]
INFO 23:54:16,042 Node /10.1.0.23 has restarted, now UP
 INFO 23:54:16,043 InetAddress /10.1.0.23 is now UP
 INFO 23:54:16,043 Node /10.1.0.23 state jump to normal
 INFO 23:54:16,088 Compacted to [/home/bigdata/data/system/LocationInfo/system-LocationInfo-hc-6-Data.db,].  544 to 413 (~75% of original) bytes for 4 keys at 0.003425MB/s.  Time: 115ms.
 INFO 23:54:16,109 Completed flushing /home/bigdata/data/system/LocationInfo/system-LocationInfo-hc-5-Data.db (163 bytes)
 INFO 23:54:16,110 Node /10.1.0.26 state jump to normal
 INFO 23:54:16,111 Bootstrap/Replace/Move completed! Now serving reads.

Run nodetool:

:~$ nodetool -h10.1.0.23 -p 8001 ring
Address         DC          Rack        Status State   Load            Owns    Token                                       
                                                                               85070591730234615865843651857942052864      
10.1.0.23      datacenter1 rack1       Up     Normal  17.77 KB        50.00%  0                                           
10.1.0.26      datacenter1 rack1       Up     Normal  17.66 KB        50.00%  85070591730234615865843651857942052864      
 

WE HAVE A RING!

NEXT: SETTING UP OPS CENTER

Drop keyspace using Cassandra Cli

Dropping a an entire keyspace using the cassandra-cli is exceptionally simple.

First, access your cluster using the cli. I have an alias in my .bash_profile so I only need to type ‘cass’ to access the clid. In an attempt to be helpful though, I shall show the full command syntax for my environment. Your host and port may vary.

  alias cass='cassandra-cli -h 10.1.0.26'

In this example, I am going to drop the keyspace I was loading with test data in previous posts, ks33.

hpcass: ~$ cass
Connected to: "Test1" on 10.1.0.23/9160
Welcome to Cassandra CLI version 1.0.8

Type 'help;' or '?' for help.
Type 'quit;' or 'exit;' to quit.

DROP keyspace ks33;

07ad5e00-7120-11e1-0000-13393ec611bd
Waiting for schema agreement...
... schemas agree across the cluster
[default@unknown] 

That’s all there was to it. Keyspace destroyed.

Previous Cassandra related articles


Cassandra – Running some simple tests, including a multi-get strategy.

PREV: Re-Configuring an Empty Cassandra Cluster

Time for the rubber to meet the road. Get some data loaded and validate the theoretical concepts garnered from the documentation consumed.

This is an record example (IP’s have been changed to protect the clueless):

      ip_key: 1598595809
          ip: 10.2.162.225
     prop_id: 1033
    property: Bad Stuff
      threat: 1
   attribute: suspicious
        meta: 10.25.112.7
    detected: 2012-01-05 15:17:14
detected_sec: 1325805434
    reported: 2012-01-06 01:44:02
reported_sec: 1325843042

Preliminary model concept centers around the IP, however with over 60,000,000 records there are overlaps, so a single IP is not going to survive as the primary key. Trying to get a distribution out of MySQL takes some time. Here are some distributions by key. Thousands of of events per IP, and this is just a short 1 month window:

+------------+--------+
| ip_dec     | events |
+------------+--------+
| 3158358206 |   2705 |
|  652542280 |   2506 |
| 3495573656 |   2089 |
| 3232235778 |   2015 |
| 1072721396 |   1528 |
|  652542281 |   1432 |
| 3232235876 |   1427 |
| 3448822506 |   1232 |
| 1280052209 |   1106 |
| 3232235779 |   1086 |
+------------+--------+

Now, Cassandra will support MILLIONS of column items on a single row, thus, this actually might work, and scale without using Super Column Families (SCFs). Using the detected time seconds as the column name with an attribute suffix, then enclosing the data in a JSON blob could provide the required results. Using the datekey as a secondary index across the columns, or using them as a time progression. Concepts that need to be tested, which precisely the task at hand.

Considering that a good detected time is not always available, and the data is processed in batches, there could be a heavy grouping of timestamps. If there are a variety of issues detected on a specific IP, at the same obfuscated time, loss of data will occur. This is certainly NOT the desired result. Given this, the datastamp is not unique enough for a hash structure datastore such as Cassandra, without using SCFs.

A structure such as this could deliver the required granularity:

ipstore[$ipkey][$timekey][$propkey] = JSON:{}, JSON:{}, JSON{}...  ;

To get started with loading data, wrote a quick test program in Java, compliled it and ran it:

test1.java – source code

public class test1 {
  public static void main (String [] args) {
    System.out.println("Cassandra Calling!");
  }
}

compiling….

java/src/loader1$ javac test1.java -d ../../class/.

executing…

/java/class$ java test1
Cassandra Calling!

Environment confirmed for compiling loader code. With a model in mind…

ipstore[$ipkey][$popkey][$timestamp] = JSON:{}

..and IP data to load,

ipp < get_a_million.sql > a_million_ips.dta
cass:~$ ls -l
126180075 2012-03-13 13:06 a_million_ips.dta

cass:~$ wc -l a_million_ips.dta
1000001 a_million_ips.dta

...next it's designing the schema builder and loader.

REFERENCE: Setting up a Java build env to prepare for Cassandra development

With the environment confirmed, and a test file (test1.java) written, execute and verify function:

cass:~$ ant -DclassToRun=test1 run
Buildfile: ./build.xml

[...]

run:
     [java] This is Java.... drink up!

VERIFIED.

To get moving forward, I created a Utilities class and a DB connector Class. You can look at the source code for those at these two links:

Util Source Code

Cassandra DB Connector Source Code

With the code done, need to perform a couple of house keeping tasks to get it prepared for loading.

Adding the ks33 keyspace

[default@unknown] create keyspace ks33:
c7944700-6e2e-11e1-0000-13393ec611bd
Waiting for schema agreement...
... schemas agree across the cluster

[default@unknown] use ks33;
Authenticated to keyspace: ks33

Adding the cf33 ColumnFamily to ks33 Keyspace:

[default@ks33] create column family cf33 with comparator = UTF8Type; 
2501f8b0-6e2f-11e1-0000-13393ec611bd
Waiting for schema agreement...
... schemas agree across the cluster

Next, to load 100 trial rows. Here is a link to the source code:

Source for useMultiGet (tba)

hpcass@feed0:~/cassIP/java/cBuild$ host=10.1.0.123 port=9160 inserts=100 ks=ks33 cf=cf33 ant -DclassToRun=c01.useMultiGet run
Buildfile: /home/hpcass/cassIP/java/cBuild/build.xml

init:

compile:
    [javac] Compiling 1 source file to /home/hpcass/cassIP/java/cBuild/build/classes

dist:
      [jar] Building jar: /home/hpcass/cassIP/java/cBuild/dist/lib/cassIP.jar

run:
     [java] get time   89062577
     [java] mget time 494039096

BUILD SUCCESSFUL

Here are some results from multi-get tests. It's actually the inverse of my hope, the multi-get seems to rapidly lose it's benefit.

5 Item Slices  (1000 item dataset)
=========================================================
run:                    RUN 1      RUN 2      RUN 3   
     [java] get time  339041199  436440551  358115310
     [java] mget time 172484370  174690508  182833140

10 Item Slices  (1000 item dataset)
=========================================================
run:                    RUN 1      RUN 2      RUN 3   
     [java] get time  346512511  332820479  314136351
     [java] mget time 394049160  251152592  234719383

25 Item Slices  (1000 item dataset)
=========================================================
run:                    RUN 1      RUN 2      RUN 3   
     [java] get time  335286775  293802010  295948562
     [java] mget time 464933443  324505741  312226035

What I didn't expect to see, based on the information in the 'High Performance
Cookbook, was rapid fall-off in performance, and in face in all cases in the
slices of size 25 inverted the performance, showing that it became worse.

2 Item Slices  (1000 item dataset)
=========================================================
run:                    RUN 1      RUN 2      RUN 3   
     [java] get time  285509637  331970814  317512021
     [java] mget time 104567639   96477512  124040195

One thing I didn't think of testing was doing a slice of size 1, and see if maybe part of the perceived performance in the lower slices is really cache hits. AH! Look at this, it looks like the *test* is highly suspect at best. I think this shows some evidence the performance 'benefit' of the multi-get is really a cache hit artifact from extracting the exact same data a second time:

host=10.1.0.123 port=9160 inserts=1000 ks=ks33 cf=cf33 slice=1 ant -DclassToRun=c01.useMultiGet run
Buildfile: /home/hpcass/cassIP/java/cBuild/build.xml

1 Item Slices  (1000 item dataset)
=========================================================
run:                    RUN 1      RUN 2      RUN 3   
     [java] get time  295158535  298466321  283438099
     [java] mget time 109982545  103658894   98260286

This demonstrator failure to perform, is not a failure in and of itself. It's provided useful information regarding some concepts recommended in some documentation, but may not really be a true best practice. I long ago developed a healthy skepticism of expert advice in lieu of verification.

Re-Configuring an Empty Cassandra Cluster

PREV: Setting up a Java build env to prepare for Cassandra development

After doing more research, I decided the Ordered Partitioning was not going to buy me anything but a lop-sided distribution. Looking at this (it’s a case of IP distributions, not hostnames as originally envisioned, that will be a later evaluation).

I’d have 3 very heavy nodes and 3 very light nodes. This is a distribution of real world data.

Node:  Range:                             Dist:    
====== ================================== ======  
node00         0.0.0.0 to 42.170.170.171     6 %  
node01  42.170.170.172 to 85.85.85.87       32 %  
node02     85.85.85.88 to 128.0.0.3         34 %  
node03       128.0.0.4 to 170.170.170.175    2 %  
node04 170.170.170.176 to 213.85.85.91      21 %  
node05    213.85.85.92 to 255.255.255.255    3 %  

Goofing around with pseudo random key naming to get a better balance only does one thing, make the keys I wanted to use (IPs) basically worthless, so the ordering is wrecked regardless. Random partitioning is the default configuration for Cassandra, so, that’s what I plan to use. Problem is, I’d built out this specific node set with this setting first:

ByteOrderedPartitioner orders rows lexically by key bytes. BOP allows scanning rows in key order, but the ordering can generate hot spots for sequential insertion workloads.

I re-set the configurations to use the default instead:

RandomPartitioner distributes rows across the cluster evenly by md5. When in doubt, this is the best option.

After changing the configuration from ByteOrderedPartitioner to RandomPartitioner and restarting the first node.. I am greeted with this happy message:

ERROR 13:03:36,113 Fatal exception in thread Thread[SSTableBatchOpen:3,5,main]
java.lang.RuntimeException: Cannot open /home/hpcass/data/node00/system/Versions-hc-3 because partitioner does not match org.apache.cassandra.dht.RandomPartitioner

In fact I’m greeted with a lot of them. This is then followed by what looks like possibly.. normal startup messaging?

 INFO 13:03:36,166 Creating new commitlog segment /home/hpcass/commitlog/node00/CommitLog-1331586216166.log
 INFO 13:03:36,175 Couldn't detect any schema definitions in local storage.
 INFO 13:03:36,175 Found table data in data directories. Consider using the CLI to define your schema.
 INFO 13:03:36,197 Replaying /home/hpcass/commitlog/node00/CommitLog-1331328557751.log
 INFO 13:03:36,222 Finished reading /home/hpcass/commitlog/node00/CommitLog-1331328557751.log
 INFO 13:03:36,227 Enqueuing flush of Memtable-LocationInfo@1762056890(213/266 serialized/live bytes, 7 ops)
 INFO 13:03:36,228 Writing Memtable-LocationInfo@1762056890(213/266 serialized/live bytes, 7 ops)
 INFO 13:03:36,228 Enqueuing flush of Memtable-Versions@202783062(83/103 serialized/live bytes, 3 ops)
 INFO 13:03:36,277 Completed flushing /home/hpcass/data/node00/system/LocationInfo-hc-16-Data.db (377 bytes)
 INFO 13:03:36,285 Writing Memtable-Versions@202783062(83/103 serialized/live bytes, 3 ops)
 INFO 13:03:36,357 Completed flushing /home/hpcass/data/node00/system/Versions-hc-4-Data.db (247 bytes)
 INFO 13:03:36,358 Log replay complete, 9 replayed mutations
 INFO 13:03:36,366 Cassandra version: 1.0.8
 INFO 13:03:36,366 Thrift API version: 19.20.0
 INFO 13:03:36,367 Loading persisted ring state
 INFO 13:03:36,384 Starting up server gossip
 INFO 13:03:36,386 Enqueuing flush of Memtable-LocationInfo@846275759(88/110 serialized/live bytes, 2 ops)
 INFO 13:03:36,386 Writing Memtable-LocationInfo@846275759(88/110 serialized/live bytes, 2 ops)
 INFO 13:03:36,440 Completed flushing /home/hpcass/data/node00/system/LocationInfo-hc-17-Data.db (196 bytes)
 INFO 13:03:36,446 Starting Messaging Service on port 7000
 INFO 13:03:36,452 Using saved token 0
 INFO 13:03:36,453 Enqueuing flush of Memtable-LocationInfo@59584763(38/47 serialized/live bytes, 2 ops)
 INFO 13:03:36,454 Writing Memtable-LocationInfo@59584763(38/47 serialized/live bytes, 2 ops)
 INFO 13:03:36,556 Completed flushing /home/hpcass/data/node00/system/LocationInfo-hc-18-Data.db (148 bytes)
 INFO 13:03:36,558 Node /10.1.0.23 state jump to normal
 INFO 13:03:36,558 Bootstrap/Replace/Move completed! Now serving reads.
 INFO 13:03:36,559 Will not load MX4J, mx4j-tools.jar is not in the classpath
 INFO 13:03:36,587 Binding thrift service to /10.1.0.23:9160
 INFO 13:03:36,590 Using TFastFramedTransport with a max frame size of 15728640 bytes.
 INFO 13:03:36,593 Using synchronous/threadpool thrift server on /10.1.0.23 : 9160
 INFO 13:03:36,593 Listening for thrift clients...

Despite the fatal errors, it does seem to have restarted the cluster with the new Partition engine:

Address         DC          Rack        Status State   Load            Owns    Token                                       
                                                                               7169015515630842424558524306038950250903273734
10.1.0.27      datacenter1 rack1       Down   Normal  ?               93.84%  -2742379978670691477635174047251157095949195165
10.1.0.23      datacenter1 rack1       Up     Normal  15.79 KB        86.37%  0                                           
10.1.0.26      datacenter1 rack1       Down   Normal  ?               77.79%  896682280808232140910919391534960240163386913
10.1.0.24      datacenter1 rack1       Up     Normal  15.79 KB        53.08%  1927726543429020693034590137790785169819652674
10.1.0.25      datacenter1 rack1       Up     Normal  15.79 KB        35.85%  6138493926725652010223830601932265434881918085
10.1.0.28      datacenter1 rack1       Down   Normal  ?               53.08%  716901551563084242455852430603895025090327373

Starting up the other three nodes (example:)

 INFO 14:10:06,663 Node /10.1.0.25 has restarted, now UP
 INFO 14:10:06,663 InetAddress /10.1.0.25 is now UP
 INFO 14:10:06,664 Node /10.1.0.25 state jump to normal
 INFO 14:10:06,664 Node /10.1.0.24 has restarted, now UP
 INFO 14:10:06,665 InetAddress /10.1.0.24 is now UP
 INFO 14:10:06,665 Node /10.1.0.24 state jump to normal
 INFO 14:10:06,666 Node /10.1.0.23 has restarted, now UP
 INFO 14:10:06,667 InetAddress /10.1.0.23 is now UP
 INFO 14:10:06,668 Node /10.1.0.23 state jump to normal
 INFO 14:10:06,760 Completed flushing /home/hpcass/data/node01/system/LocationInfo-hc-18-Data.db (166 bytes)
 INFO 14:10:06,762 Node /10.1.0.26 state jump to normal
 INFO 14:10:06,763 Bootstrap/Replace/Move completed! Now serving reads.
 INFO 14:10:06,764 Will not load MX4J, mx4j-tools.jar is not in the classpath
 INFO 14:10:06,862 Binding thrift service to /10.1.0.26:9160

Re-checking the ring displays:

Address         DC          Rack        Status State   Load            Owns    Token                                       
                                                                               7169015515630842424558524306038950250903273734
10.1.0.27      datacenter1 rack1       Up     Normal  11.37 KB        93.84%  -2742379978670691477635174047251157095949195165
10.1.0.23      datacenter1 rack1       Up     Normal  15.79 KB        86.37%  0                                           
10.1.0.26      datacenter1 rack1       Up     Normal  18.38 KB        77.79%  896682280808232140910919391534960240163386913
10.1.0.24      datacenter1 rack1       Up     Normal  15.79 KB        53.08%  1927726543429020693034590137790785169819652674
10.1.0.25      datacenter1 rack1       Up     Normal  15.79 KB        35.85%  6138493926725652010223830601932265434881918085
10.1.0.28      datacenter1 rack1       Up     Normal  15.79 KB        53.08%  7169015515630842424558524306038950250903273734

Switching partition engine appears to be easy enough. What I suspect however (and I’ve not confirmed this, is that the data would have been compromised or likely destroyed in this process. The documentation I’ve read so far indicated that you could not do this. Once setup with a specific partitioning engine that cluster was bound to it.

My conclusion is that if you have not yet started to saturate your cluster with data, and you wish to change the partitioning engine, it would appear that the right time to do it is now.. before you start to load data.

I plan to test this theory later after the first trial data load to see if in fact it mangles the information. More to follow!

UPDATE!

Despite the information that I thought nodetool was telling me, my cluster was unusable because of the partitioner change. What is the last step required to change partition? NUKE THE DATA. Unfun.. but that is what I need to do.

Having 6 nodes means 6 times the fun. Here is the kicker though, I’ll just move the data aside and re-construct, and that will let me swap it back in if I decided to go back and forth testing the impacts of Random vs. Ordered for my needs. Will I get away with this? I don’t know. That won’t stop me from trying!

The data was stored in ~/data/node00 (node## etc.). This is all I did:

mv data/node00 data/node00-bop       # bop = btye order partition.

Restarted node00:

hpcass:~/nodes$ node00/bin/cassandra -f
 INFO 16:38:46,525 Logging initialized
 INFO 16:38:46,529 JVM vendor/version: OpenJDK 64-Bit Server VM/1.6.0_0
 INFO 16:38:46,529 Heap size: 6291456000/6291456000
 INFO 16:38:46,529 Classpath: node00/bin/../conf:node00/bin/../build/classes/main:node00/bin/../build/classes/thrift:node00/bin/../lib/antlr-3.2.jar:node00/bin/../lib/apache-cassandra-1.0.8.jar:node00/bin/../lib/apache-cassandra-clientutil-1.0.8.jar:node00/bin/../lib/apache-cassandra-thrift-1.0.8.jar:node00/bin/../lib/avro-1.4.0-fixes.jar:node00/bin/../lib/avro-1.4.0-sources-fixes.jar:node00/bin/../lib/commons-cli-1.1.jar:node00/bin/../lib/commons-codec-1.2.jar:node00/bin/../lib/commons-lang-2.4.jar:node00/bin/../lib/compress-lzf-0.8.4.jar:node00/bin/../lib/concurrentlinkedhashmap-lru-1.2.jar:node00/bin/../lib/guava-r08.jar:node00/bin/../lib/high-scale-lib-1.1.2.jar:node00/bin/../lib/jackson-core-asl-1.4.0.jar:node00/bin/../lib/jackson-mapper-asl-1.4.0.jar:node00/bin/../lib/jamm-0.2.5.jar:node00/bin/../lib/jline-0.9.94.jar:node00/bin/../lib/json-simple-1.1.jar:node00/bin/../lib/libthrift-0.6.jar:node00/bin/../lib/log4j-1.2.16.jar:node00/bin/../lib/servlet-api-2.5-20081211.jar:node00/bin/../lib/slf4j-api-1.6.1.jar:node00/bin/../lib/slf4j-log4j12-1.6.1.jar:node00/bin/../lib/snakeyaml-1.6.jar:node00/bin/../lib/snappy-java-1.0.4.1.jar
 INFO 16:38:46,531 JNA not found. Native methods will be disabled.
 INFO 16:38:46,538 Loading settings from file:/home/hpcass/nodes/node00/conf/cassandra.yaml
 INFO 16:38:46,635 DiskAccessMode 'auto' determined to be mmap, indexAccessMode is mmap
 INFO 16:38:46,645 Global memtable threshold is enabled at 2000MB
 INFO 16:38:46,839 Creating new commitlog segment /home/hpcass/commitlog/node00/CommitLog-1331599126839.log
 INFO 16:38:46,848 Couldn't detect any schema definitions in local storage.
 INFO 16:38:46,849 Found table data in data directories. Consider using the CLI to define your schema.
 INFO 16:38:46,863 Replaying /home/hpcass/commitlog/node00/CommitLog-1331597615041.log
 INFO 16:38:46,887 Finished reading /home/hpcass/commitlog/node00/CommitLog-1331597615041.log
 INFO 16:38:46,892 Enqueuing flush of Memtable-LocationInfo@1834491520(98/122 serialized/live bytes, 4 ops)
 INFO 16:38:46,893 Enqueuing flush of Memtable-Versions@875509103(83/103 serialized/live bytes, 3 ops)
 INFO 16:38:46,894 Writing Memtable-LocationInfo@1834491520(98/122 serialized/live bytes, 4 ops)
 INFO 16:38:47,001 Completed flushing /home/hpcass/data/node00/system/LocationInfo-hc-1-Data.db (208 bytes)
 INFO 16:38:47,009 Writing Memtable-Versions@875509103(83/103 serialized/live bytes, 3 ops)
 INFO 16:38:47,057 Completed flushing /home/hpcass/data/node00/system/Versions-hc-1-Data.db (247 bytes)
 INFO 16:38:47,057 Log replay complete, 6 replayed mutations
 INFO 16:38:47,066 Cassandra version: 1.0.8
 INFO 16:38:47,066 Thrift API version: 19.20.0
 INFO 16:38:47,067 Loading persisted ring state
 INFO 16:38:47,070 Starting up server gossip
 INFO 16:38:47,091 Enqueuing flush of Memtable-LocationInfo@952443392(88/110 serialized/live bytes, 2 ops)
 INFO 16:38:47,092 Writing Memtable-LocationInfo@952443392(88/110 serialized/live bytes, 2 ops)
 INFO 16:38:47,141 Completed flushing /home/hpcass/data/node00/system/LocationInfo-hc-2-Data.db (196 bytes)
 INFO 16:38:47,149 Starting Messaging Service on port 7000
 INFO 16:38:47,155 Using saved token 0
 INFO 16:38:47,157 Enqueuing flush of Memtable-LocationInfo@1623810826(38/47 serialized/live bytes, 2 ops)
 INFO 16:38:47,157 Writing Memtable-LocationInfo@1623810826(38/47 serialized/live bytes, 2 ops)
 INFO 16:38:47,237 Completed flushing /home/hpcass/data/node00/system/LocationInfo-hc-3-Data.db (148 bytes)
 INFO 16:38:47,239 Node /10.1.0.23 state jump to normal
 INFO 16:38:47,240 Bootstrap/Replace/Move completed! Now serving reads.
 INFO 16:38:47,241 Will not load MX4J, mx4j-tools.jar is not in the classpath
 INFO 16:38:47,269 Binding thrift service to /10.1.0.23:9160
 INFO 16:38:47,272 Using TFastFramedTransport with a max frame size of 15728640 bytes.
 INFO 16:38:47,274 Using synchronous/threadpool thrift server on /10.1.0.23 : 9160
 INFO 16:38:47,275 Listening for thrift clients...

^Z
[1]+  Stopped                 node00/bin/cassandra -f
hpcass:~/nodes$ bg
[1]+ node00/bin/cassandra -f &

With the process backgrounded, checked the files in the new data directory for my node:

hpcass:~/data/node00$ ls -1 system
LocationInfo-hc-1-Data.db
LocationInfo-hc-1-Digest.sha1
LocationInfo-hc-1-Filter.db
LocationInfo-hc-1-Index.db
LocationInfo-hc-1-Statistics.db
LocationInfo-hc-2-Data.db
LocationInfo-hc-2-Digest.sha1
LocationInfo-hc-2-Filter.db
LocationInfo-hc-2-Index.db
LocationInfo-hc-2-Statistics.db
LocationInfo-hc-3-Data.db
LocationInfo-hc-3-Digest.sha1
LocationInfo-hc-3-Filter.db
LocationInfo-hc-3-Index.db
LocationInfo-hc-3-Statistics.db
Versions-hc-1-Data.db
Versions-hc-1-Digest.sha1
Versions-hc-1-Filter.db
Versions-hc-1-Index.db
Versions-hc-1-Statistics.db

Following that clearing and rebuild, I see the node tool results look a lot better:

hpcass@feed0:~/nodes$ cass00/bin/nodetool -h localhost ring
Address         DC          Rack        Status State   Load            Owns    Token                                       
                                                                               6138493926725652010223830601932265434881918085
10.1.0.23      datacenter1 rack1       Up     Normal  15.68 KB        33.29%  0                                           
10.1.0.24      datacenter1 rack1       Up     Normal  18.34 KB        30.87%  1927726543429020693034590137790785169819652674
10.1.0.25      datacenter1 rack1       Up     Normal  18.34 KB        35.85%  6138493926725652010223830601932265434881918085

After resetting the old numerated nodes, I had a complete disaster! Negative node tokens? How did that happen? Restarts did nothing to fix this either.

Address         DC          Rack        Status State   Load            Owns    Token                                       
                                                                               7169015515630842424558524306038950250903273734
10.1.0.27      datacenter1 rack1       Up     Normal  15.79 KB        93.84%  -2742379978670691477635174047251157095949195165
10.1.0.23      datacenter1 rack1       Up     Normal  15.79 KB        86.37%  0                                           
10.1.0.26      datacenter1 rack1       Up     Normal  15.79 KB        77.79%  896682280808232140910919391534960240163386913
10.1.0.24      datacenter1 rack1       Up     Normal  15.79 KB        53.08%  1927726543429020693034590137790785169819652674
10.1.0.25      datacenter1 rack1       Up     Normal  15.79 KB        35.85%  6138493926725652010223830601932265434881918085
10.1.0.28      datacenter1 rack1       Up     Normal  15.79 KB        53.08%  7169015515630842424558524306038950250903273734

To resolve this, I simply re-ran my token generator to get a new set of tokens:

node00	10.1.0.23  token: 0
node01	10.1.0.26  token: 28356863910078205288614550619314017621
node02	10.1.0.24  token: 56713727820156410577229101238628035242
node03	10.1.0.27  token: 85070591730234615865843651857942052863
node04	10.1.0.25  token: 113427455640312821154458202477256070485
node05	10.1.0.28  token: 141784319550391026443072753096570088106

Followed by manually setting the tokens in the ring:

bin/nodetool -h 10.1.0.24 move 56713727820156410577229101238628035242
bin/nodetool -h 10.1.0.25 move 113427455640312821154458202477256070485

bin/nodetool -h 10.1.0.26 move 28356863910078205288614550619314017621
bin/nodetool -h 10.1.0.27 move 85070591730234615865843651857942052863
bin/nodetool -h 10.1.0.28 move 141784319550391026443072753096570088106

This.. gave me the results I was expecting!

Address         DC          Rack        Status State   Load            Owns    Token                                       
                                                                               141784319550391026443072753096570088106     
10.1.0.23      datacenter1 rack1       Up     Normal  24.95 KB        16.67%  0                                           
10.1.0.26      datacenter1 rack1       Up     Normal  20.72 KB        16.67%  28356863910078205288614550619314017621      
10.1.0.24      datacenter1 rack1       Up     Normal  25.1 KB         16.67%  56713727820156410577229101238628035242      
10.1.0.27      datacenter1 rack1       Up     Normal  13.38 KB        16.67%  85070591730234615865843651857942052863      
10.1.0.25      datacenter1 rack1       Up     Normal  25.1 KB         16.67%  113427455640312821154458202477256070485     
10.1.0.28      datacenter1 rack1       Up     Normal  25.14 KB        16.67%  141784319550391026443072753096570088106   

Now, the question of actually connecting to the cluster can be answered. Pick one of the nodes and ports to connect too. I picked node00 on .23 (cli defaulted to port 9160 so I didn’t have to specify that):

node00/bin/cassandra-cli -h 10.1.0.23 
Connected to: "test-ip" on 10.1.0.23/9160
Welcome to Cassandra CLI version 1.0.8

Type 'help;' or '?' for help.
Type 'quit;' or 'exit;' to quit.

The big problem I had, was that the cli never did seem to respond. The trick is to end your command with a semi-colon. That might seem obvious to you, and generally obvious to me.. but I’d not seen the docs actually call out that little FACT.

[default@unknown] show cluster name;
test-ip

Created a test column family from the helpful Cassandra Wiki.

create keyspace Twissandra;
Keyspace names must be case-insensitively unique ("Twissandra" conflicts with "Twissandra")
[default@unknown] 
[default@unknown] 
[default@unknown] create column family User with comparator = UTF8Type;
Not authenticated to a working keyspace.
[default@unknown] use Twissandra;
Authenticated to keyspace: Twissandra
[default@Twissandra] create column family User with comparator = UTF8Type;
adf453a0-6cb0-11e1-0000-13393ec611bd
Waiting for schema agreement...
... schemas agree across the cluster
[default@Twissandra] 

AND WE’RE OFF!! Next article will cover actually finishing up this last test and then adding real data. MORE TO COME!!

NEXT: Cassandra – A Use case examined (IP data)

Cassandra and Big Data – building a single-node “cluster”

Cassandra – Getting off the ground.
Continuation of post: Apache Cassandra Project – processing “Big Data”

While researching a project on Big Data services, I knew that I’d need a multi-node cluster to experiment with, but a pile of hardware was not immediately available.

Using the VERY helpful book Cassandra High Performance Cookbook I was able to build a 3 node cluster on a single machine. This is how I did it:


For this cluster test example, I am using Ubunto 10, with following JVM

      JVM vendor/version: OpenJDK 64-Bit Server VM/1.6.0_22

Downloaded Cassandra 1.0.8 package from here:
http://apache.mirrors.tds.net//cassandra/1.0.8/apache-cassandra-1.0.8-bin.tar.gz

Created new user on system: bigdata

Create the required base data directories

  $ mkdir commitlog,log,data,saved_caches

Moved that package there and started the build

$ cp /tmp/apache-cassandra-1.0.8-bin.tar.gz .

Unzipped and extracted the contents

$ gunzip apache-cassandra-1.0.8-bin.tar.gz
$ tar xvf apache-cassandra-1.0.8-bin.tar

Moved the long directory name to first instance cassA-1.0.8

$ mv apache-cassandra-1.0.8 cassA-1.0.8

Extracted again and renamed this to the other two planned instances:

$ tar xfv apache-cassandra-1.0.8-bin.tar
$ mv apache-cassandra-1.0.8 cassB-1.0.8  

$ tar xfv apache-cassandra-1.0.8-bin.tar
$ mv apache-cassandra-1.0.8 cassC-1.0.8  

This gave me three packages to build, and each with a unique IP

  cassA-1.0.8   10.1.1.101
  cassB-1.0.8   10.1.1.102
  cassC-1.0.8   10.1.1.103

Edit configuration files in each instance (casaA-1.0.8 used as example:)

$ vi cassA-1.0.8/conf/cassandra.yaml 

[...]

# directories where Cassandra should store data on disk.
data_file_directories: 
    - /home/bigdata/data/cassA

# commit log
commitlog_directory: /home/bigdata/commitlog/cassA

# saved caches
saved_caches_directory: /home/bigdata/saved_caches/cassA

[...]

# If blank, Cassandra will request a token bisecting the range of
# the heaviest-loaded existing node.  If there is no load information
# available, such as is the case with a new cluster, it will pick
# a random token, which will lead to hot spots.
initial_token: 0

[...]

# Setting this to 0.0.0.0 is always wrong.
listen_address: 10.1.1.101

[...]

rpc_address: 10.1.1.101

[...]

          # seeds is actually a comma-delimited list of addresses.
          # Ex: ",,"
          - seeds: "10.1.100.101,10.1.100.102,10.1.100.103"
[...]

Setting a separate logfile is recommended. Edit config to set separate log

vi cassA-1.0.8/conf/log4j-server.properties

[...]
log4j.appender.R.File=/home/bigdata/log/cassA.log
[...]

Repeat for instances cassB and cassC, setting the token value for B and C to appropriate values (see Extra Credit below if you need to know how to do *that* part):

#cassB
initial_token: 56713727820156410577229101238628035242

#cassC
initial_token: 113427455640312821154458202477256070485

To enable the JMX management console, each instance will require it’s own port. Edit the env file to set that up.

vi cassA-1.0.8/conf/cassandra-env.sh

[...]
# Specifies the default port over which Cassandra will be available for
# JMX connections.
JMX_PORT="8001"
[...]

Repeated for the other two instances, defining 8002 and 8003 respectively.

Now, for the final trick, start up the instances:

  cassA-1.0.8/bin/cassandra
  cassB-1.0.8/bin/cassandra
  cassC-1.0.8/bin/cassandra

Cluster elements started up, and they can be seen active in the process table here:

$ ps -lf
F S UID        PID  PPID  C PRI  NI ADDR SZ WCHAN  STIME TTY          TIME CMD
0 S bigdata   4554     1  2  80   0 - 226846 futex_ 12:13 pts/0   00:00:05 java -ea -XX:+UseThreadPriorities -XX:ThreadPriorityPolicy=
0 S bigdata   4593     1  2  80   0 - 210824 futex_ 12:13 pts/0   00:00:05 java -ea -XX:+UseThreadPriorities -XX:ThreadPriorityPolicy=
0 S bigdata   4632     1  2  80   0 - 226830 futex_ 12:13 pts/0   00:00:05 java -ea -XX:+UseThreadPriorities -XX:ThreadPriorityPolicy=
0 R bigdata   5047  3054  0  80   0 -  5483 -      12:16 pts/0    00:00:00 ps -lf

Finally, to check the status, connect to of the JMX node ports and check the ring. You only need to connect to one of the cluster’s nodes to check the complete cluster’s status:

$ bin/nodetool -h 10.1.100.101 -port 8001 ring
Address         DC          Rack        Status State   Load            Owns    Token                                       
                                                                               113427455640312821154458202477256070485     
10.1.100.101    datacenter1 rack1       Up     Normal  21.86 KB        33.33%  0                                           
10.1.100.102    datacenter1 rack1       Up     Normal  20.28 KB        33.33%  56713727820156410577229101238628035242      
10.1.100.103    datacenter1 rack1       Up     Normal  29.1 KB         33.33%  113427455640312821154458202477256070485      

Now, that’s a functional 3 instance cluster running on a single node. These are not in separate VMs, and if you wanted to experiment with this on a larger cluster, running multiple instances on multiple VM’s on a single hypervisor.. I don’t really see why you cannot!

In the next article, I’m going to start feeding data into the cluster. Stay tuned for that!


Extra Credit:

To create the token value I needed for this three ring cluster, I used the following PERL script. BTW, bignum is required unless you want PERL printing these big numbers in scientific notation:

#!/usr/bin/perl
use bignum;
my $nodes = shift;
print "Calculate tokens for $nodes nodes\n";
print "node 0\ttoken: 0\n" unless $nodes;
exit unless $nodes;
my $factor = 2**127;
print "factor = $factor\n";
for (my $i=0;$i<$nodes;$i++) {
	my $token = $i * ( $factor / $nodes);
	print "node $i\ttoken: $token\n";
}

Running the script for three nodes gave me the following results:

$ ./maketokens.pl  3

Calculate tokens for 3 nodes
factor = 170141183460469231731687303715884105728
node 0	token: 0
node 1	token: 56713727820156410577229101238628035242.67
node 2	token: 113427455640312821154458202477256070485.34

Additional Comments:

If you are setting up a standard mutli-box cluster, make sure you have the following ports opened up on any firewalls. If not, the cluster members wont' find each other:

# TCP port, for commands and data
storage_port: 7000

# SSL port, for encrypted communication.  Unused unless enabled in
# encryption_options
ssl_storage_port: 7001

NEXT: Setting up a Java build env to prepare for Cassandra development