Category Archives: Enviromentalism

Daytime Wildlife visitors (bobcat and coyote)

Over the last couple of days we’ve had some daytime visitors along the hillside above us.

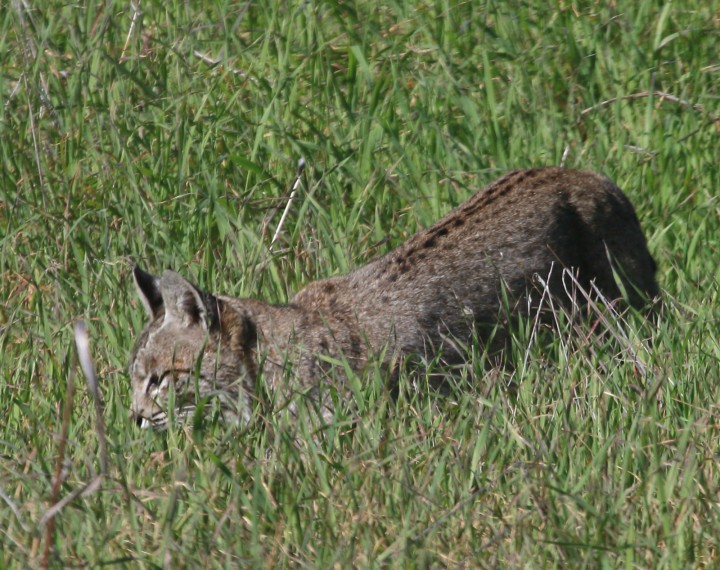
Lynx rufus

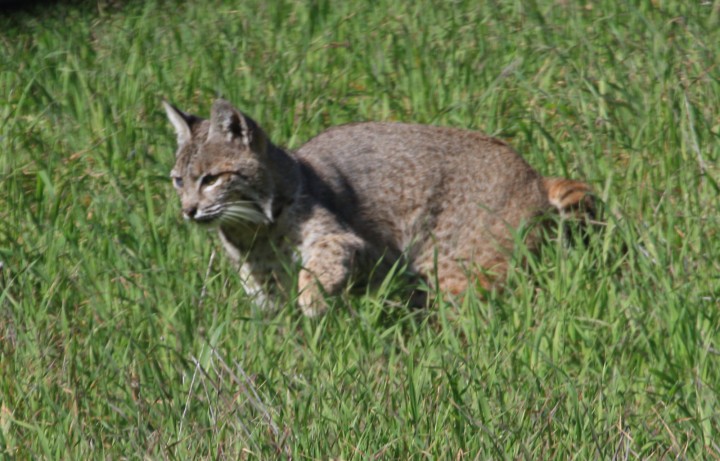
We know there are a number of predator cats in the area. I don’t often see bobcats so it was a rare treat to get a glimpse of one outside my office window:

Lynx rufus (bobcat)
Lynx rufus (bobcat)

Lynx rufus (bobcat)
Lynx rufus (bobcat)

Canis latrans

Coyotes are much more commonly sighted around here. I often catch them on the infrared wildlife camera. Seeing them during the daytime is a little less common but it does happen, as it did this morning:

Canis latrans (coyote)

GoPro3 Timelapse Video of Sunrise in Santa Cruz Mountains

A few days ago, I posted the first test video shot using 30 second exposures with a GoPro3 camera, located at our home in the Santa Cruz Mountains.

For my next test series I set the GoPro3 Camera, to fire the photos at 10 second intervals. The number of photos captured before the battery expired was almost 1100, netting a much longer and smoother looking video.

Philippines Earth Quakes, follows similar activity in Vanuatu and Papua New Guinea

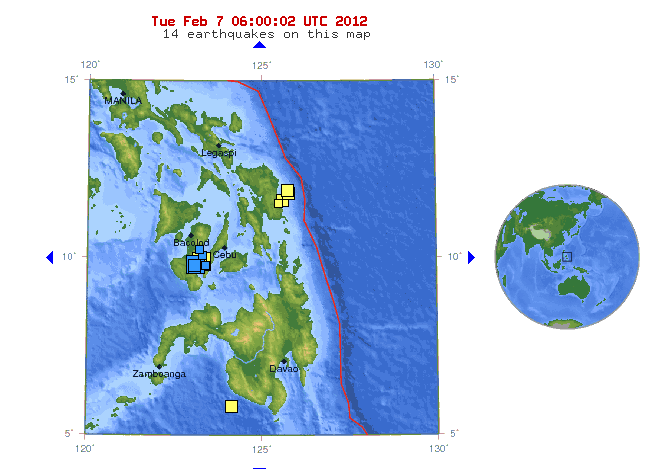
In what looks like sympathetic seismic activity, there has been a burst of quakes in the Philippines, just days after a string of large quakes not all that far south off of Vanuatu.

M 5.2 — Negros – Cebu region, Philippines
M 5.8 — Negros – Cebu region, Philippines
M 6.0 — Negros – Cebu region, Philippines
M 5.6 — Negros – Cebu region, Philippines
M 6.7 — Negros – Cebu region, Philippines

One has to wonder what in the world is going on there. Is this the precursor to more activity world wide? Does it mean anything at all?

USGS PAGER Data

USGS - PAGER map of quake cluster

Other recent strings of activity:

Complete string of Moderate Quakes Worldwide

M 5.2 — Negros – Cebu region, Philippines
M 5.8 — Negros – Cebu region, Philippines
M 6.0 — Negros – Cebu region, Philippines
M 5.6 — Negros – Cebu region, Philippines
M 6.7 — Negros – Cebu region, Philippines
M 5.1 — Fiji region
M 5.2 — Mindanao, Philippines
M 6.0 — Vanuatu
M 5.2 — Kyrgyzstan
M 5.0 — southern Iran
M 5.0 — Vanuatu
M 6.1 — Vanuatu
M 5.2 — Kepulauan Kai, Indonesia
M 5.3 — Owen Fracture Zone region
M 5.7 — Vancouver Island, Canada region
M 5.4 — Samar, Philippines
M 5.1 — central Mid-Atlantic Ridge
M 5.2 — Vanuatu
M 5.6 — Samar, Philippines
M 5.8 — Tonga
M 5.4 — central Mongolia
M 5.1 — Taiwan region
M 5.1 — New Britain region, Papua New Guinea
M 5.7 — Vanuatu
M 5.4 — Vanuatu
M 6.0 — Vanuatu
M 5.1 — Vanuatu
M 5.1 — Vanuatu
M 5.2 — Vanuatu
M 5.5 — Vanuatu
M 5.0 — Vanuatu
M 5.3 — Vanuatu
M 7.1 — Vanuatu
M 5.5 — New Britain region, Papua New Guinea
M 5.0 — New Ireland region, Papua New Guinea
M 5.4 — New Britain region, Papua New Guinea
M 5.0 — near the coast of southern Peru
M 5.0 — west of Macquarie Island
M 5.3 — Easter Island region
M 5.6 — southern Sumatra, Indonesia
M 5.2 — Samar, Philippines
M 5.1 — Vanuatu

Massive Earth Quake Activity in Vanuatu this week

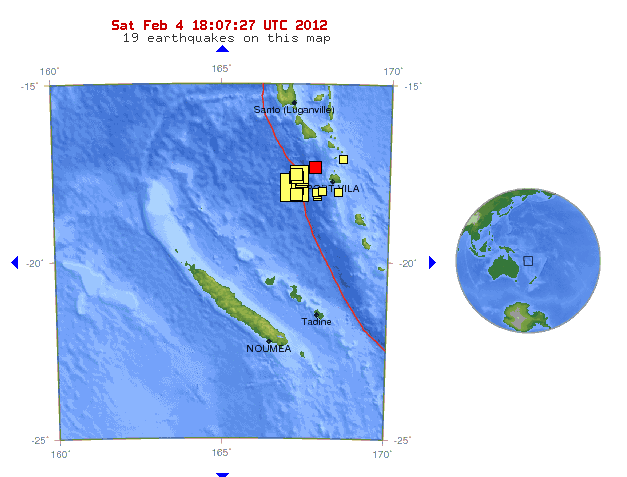
A series of large quakes has hit the area near Vanuatu.

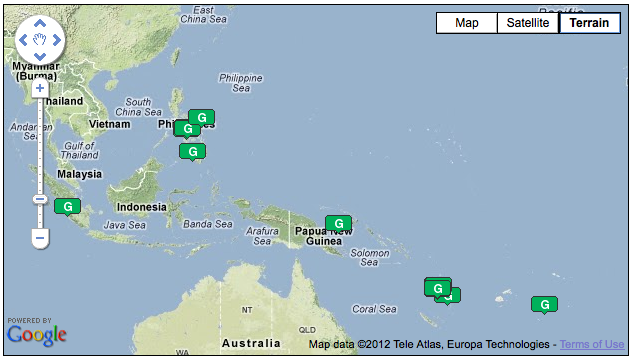
Here is a snapshot of the activity tracked on my homepage [ LINK ]. There have been big quakes near there for some time, but this is cluster of very large events:

M 5.0 — Vanuatu
M 6.1 — Vanuatu
M 5.2 — Vanuatu
M 5.7 — Vanuatu
M 5.4 — Vanuatu
M 6.0 — Vanuatu
M 5.1 — Vanuatu
M 5.1 — Vanuatu
M 5.2 — Vanuatu
M 5.5 — Vanuatu
M 5.0 — Vanuatu
M 5.3 — Vanuatu
M 7.1 — Vanuatu
M 5.1 — Vanuatu

It would appear that there is a some significant seismic activity in that region. Other areas like New Zealand and the seemingly always active Papua New Guinea are also seeing events.

M 5.0 — Kermadec Islands, New Zealand
M 5.4 — Kermadec Islands, New Zealand
M 5.2 — Kermadec Islands, New Zealand

M 5.5 — New Britain region, Papua New Guinea
M 5.0 — New Ireland region, Papua New Guinea
M 5.4 — New Britain region, Papua New Guinea
M 5.1 — New Britain region, Papua New Guinea
M 5.3 — Papua, Indonesia

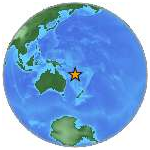
The largest of the recent events [ LINK ] happened Thursday, February 02, 2012 at 13:34:40 UTC.

As illustrated in this clipping from the USGS Map for the event, there has been a lot of large quake activity in the last 7 days.

Fortunately, despite the area having structures vulnerable to shaking damage, the estimated threat to population due to distance is virtually nil [ LINK ]. It’s estimated less that there was a 30% chance of any fatality, and a 4% chance of more than 30.

Epicenter for the quakes appears to be on a submarine ridge between two island chains. A very nice nursery for a tsunami, should there be significant under sea land movement from a large event.

As always, I continue to watch worldwide seismic events on my home page: [ LINK ].

UPDATE: – 4-FEB-2012 21:20

More activity near the epicenter of that large quake of Vanuatu… these in just the last few hours:

M 5.0 — Vanuatu
M 6.1 — Vanuatu
M 5.2 — Vanuatu

EARTHQUAKE!! OK.. it was only a 3.9

Just before 8:00AM, while reading, I got that sinking feeling. “Hm.. crap.. that’s an earth quake!”. It was mild, sort of like the little warning you’d get when a big-un is about to unleash some havoc. Then.. quiescence. But, you know a quake when you feel one. It’s nothing like a bus or truck driving by.

At any rate… about an hour later a friend of mine shot me a link from the Seattle Times, so I went and checked the USGS site again (my first check was only for my local area.. it was so small I figured it was local). Turns out it was far away, far south of Olympia.

M3.9 – Washington

Magnitude 3.9 - Tuesday, November 16, 2010 at 15:51:08 UTC

At least my PTSD did not kick in this time, although, I did start to get a little anxious. Geez. PTSD sucks… really.. I can’t image how bad it can get for our troops..

Setting up a custom ‘Weather Reader’ (Part 3) – Using Data


<– Part 2

It would be short work to grab the current observations from the local station’s file, then grab the full projected forecast from the Zone’s XML formatted data file (example for Bremerton). I checked the full forecast XML, and unfortunately it does not include the local current conditions. In the grand scheme, this is not a big deal since I’ll need to grab three forecast files already. One more file for current observations is not that much more of a burden.

This section contains the Maximum Forecast Temperatures, covering outlook:

<temperature type="minimum" units="Fahrenheit" time-layout="k-p24h-n7-1">
<name>Daily Minimum Temperature</name>
<value>40</value>
<value>45</value>
<value>43</value>
<value>44</value>
<value>43</value>
<value>43</value>
<value>42</value>
</temperature>

This section contains the Minimum Forecast Temperatures, covering outlook:

<temperature type="maximum" units="Fahrenheit" time-layout="k-p24h-n7-2">
<name>Daily Maximum Temperature</name>
<value>59</value>
<value>61</value>
<value>60</value>
<value>61</value>
<value>61</value>
<value>60</value>
<value>60</value>
</temperature>

Also in the file is the projected percentage of precipitation:

<probability-of-precipitation type="12 hour" units="percent" time-layout="k-p12h-n14-1">
<name>12 Hourly Probability of Precipitation</name>
<value xsi:nil="true"/>
<value>30</value>
<value>30</value>
<value xsi:nil="true"/>
</probability-of-precipitation>

The XML also is kind enough to include the image names.   Based on this, the actual visually rendered page is a style sheet applied to the XML data, providing a human readable web page <i>(something I need to get more familiar with)</i>.

<conditions-icon type="forecast-NWS" time-layout="k-p12h-n14-1">
<name>Conditions Icon</name>
<icon-link>http://www.nws.noaa.gov/weather/images/fcicons/nbkn.jpg</icon-link>
<icon-link>http://www.nws.noaa.gov/weather/images/fcicons/sct.jpg</icon-link>
<icon-link>http://www.nws.noaa.gov/weather/images/fcicons/nsct.jpg</icon-link>
<icon-link>http://www.nws.noaa.gov/weather/images/fcicons/bkn.jpg</icon-link>
<icon-link>http://www.nws.noaa.gov/weather/images/fcicons/nbkn.jpg</icon-link>
<icon-link>http://www.nws.noaa.gov/weather/images/fcicons/shra30.jpg</icon-link>
<icon-link>http://www.nws.noaa.gov/weather/images/fcicons/nshra30.jpg</icon-link>
<icon-link>http://www.nws.noaa.gov/weather/images/fcicons/shra.jpg</icon-link>
<icon-link>http://www.nws.noaa.gov/weather/images/fcicons/nshra.jpg</icon-link>
<icon-link>http://www.nws.noaa.gov/weather/images/fcicons/shra.jpg</icon-link>
<icon-link>http://www.nws.noaa.gov/weather/images/fcicons/nshra.jpg</icon-link>
<icon-link>http://www.nws.noaa.gov/weather/images/fcicons/shra.jpg</icon-link>
<icon-link>http://www.nws.noaa.gov/weather/images/fcicons/nshra.jpg</icon-link>
<icon-link>http://www.nws.noaa.gov/weather/images/fcicons/shra.jpg</icon-link>
</conditions-icon>

Design and coding of the file downloads, processing and construction of the status file is the next step.  One thought I have, is to download and store locally, all the images.  This will keep my page off of their webserver’s request log.  External includes of images can be a burden on a remote server, if you start to abuse it.  No sense in being a bad netizen.  The question that I need to answer is, <i>CAN I</i> get a list of all the potential images (and there are <i>many</i>) and automate the download to system I plan to run this little product upon.

Automation

Automation of the XML downloading and parsing, will be handled by PERL (at least in this first tool, it may be converted to JAVA on a second iteration, once I’ve performed usability testing of this first iteration).

Additional binary libraries are required first:

apt-get install libxml2-dev

So, here is the skinny. First, have to move into the location where CPAN unravels the packages:

cd /root/.cpan/build

Next, move into the directory for XML::LibXML and manually build with these steps:

cd XML-LibXML-1.70-OucP9U
perl Makefile.PL
make
make install

Next build the XML::Atom package:

cd XML-Atom-0.37-pcVvAG/
perl Makefile.PL
make
make install

Next, a few PERL modules must first be installed. NOTE: the XML::SAX modules are suggested, to provide a big boost in XML parsing performance. You might be surprised at how much processing power the typical XML parsing packages require. XML::SAX and XML::SAX::Expat provide a better code for XML parsing.

cpan LWP::UserAgent
cpan HTML::TokeParse
cpan XML::Feed
cpan XML::SAX
cpan XML::SAX::Expat
cpan Data::Dumper
cpan XML::Feed
cpan XML::Atom

NOTE:
As hard as I tried, CPAN would not install XML::LibXML nor XML::Atom. So, I had to get down into the muck and manually build the packages. The trick was getting the libxml2 package talked about earlier.

One critical required step, if you are going to write and use custom PERL libraries, you need to add the following line to a shell initialization file. I’ve been using bash, for lack of any reason to use other shells. Thus, I added this line to my ~/.bash_profile

export PERL5LIB=$HOME/plib

Once that is done, you’ll need to source the updated config file, or logout/login to gain the benefits of the change.

Step 4 – coming soon
Setting up a custom ‘Weather Reader’ (Part 2)

<-- PART 1

Locating Suitable Data Sources

The process of finding the desirable data sources, can be a challenge. I already know which of the 5 day forecast sources I want to use.

Bremerton, WA

Tacoma, WA

Seattle, WA

Maybe I’ll add this one too, just to so I’m reminded of what I’m missing in CA:

Campbell, CA

Next is a page that contains the CURRENT and HIGH / LOW temps. In the past I have located some text based data files on the NOAA.GOV website. I’ll have to dig up my notes one this. From time to time NOAA moves those files and changes the format, so those notes might not end up being that helpful. It is somewhere to start.

This page here, has a pile of nice detailed information (see compressed screen shot) but does not contain everything I’m looking for:

Recent WX from Bremerton National Airport.

XML DATA!. XML is something I know more about, than I really care too, but it is a portable, easily parsable and text data format. I’ve not yet investigated the contents here, but it does look promising!

Washington State WX XML Feeds

TO BE CONTINUED TODAY

Part 3 –>

Setting up a custom ‘Weather Reader’ (Part 1) – Product Plan

What is a “Weather Reader”? Well, it’s like a “News Reader”, but it’s purpose is to check the web for local weather conditions and display them on a computer screen. For this project I’ve revived an old Averatec laptop, installed Ubuntu 9.10 on it and started to write some PERL.

Beat up old Averatec AMD64 laptop, only 1/2 the keyboard works and the battery is shot.

Weather Data

Where to get the weather data? Personally, I like to go to the source. The public source at NOAA.gov. This is a government agency, paid for by my tax dollars (and yours too if you’re a US tax payer.. of which only 53% of working people in the US are, but that’s another story. So, free for the taking as far as I can tell, and am concerned. Which is good, because the real heavy work is up to me. Finding a URL is one thing, using it for something productive is another thing.

To see what I’m looking at as a source without clicking a bunch of links, here is a screen shot of my indented HTML victim:

Seattle Weather from NOAA website.

Now, the only part that I’m interested in is this one:

I’m sure some of you are asking, “WHAT’S THE POINT!?!?!?”. Well, I have several, not all atop my head. As an avid motorcyclist, weather is almost as import to me as mariners and aviators. Weather might look good for the moment, but around here anything can happen. It’s good to know what the forecast is. And not just in one location. Since I transit two area micro-climates commuting to work, knowing that weather will be at the end points of my journey are are a minimum requirement. Plus, I’m lazy. Not so lazy I won’t write a program to do this, but lazy in the larger sense, of I just want to hit a button and see all the data I want, not have to wait for the Weather Chanel to decided it’s ready to dispense it’s forecast, or hunt around on various local news sites. Nor, frankly, have to click on TWO hyperlinks to see what weather will be like HERE and THERE. Nope, I’m just too lazy for that, so I’ll spend 8-32 hours figuring out a way to save myself 2-3 minutes a day (I didn’t say I’m always smart, but always lazy). Remember; “Laziness is the father of invention!”. Digressing….

The Plan

The plan is to use PERL, run every 30 minutes from 5 AM-> 1 AM, and grab the weather page shown above. Parse out only that which I want, and then re-construct my own page on my own server. It’s a basically a mashup page of what I want to see.

Checking the source code of the page, I see that, ugh, NOAA did not supply and useful DIV markers that I can use. So, this will be a rel brute-force process to detect, select, extract and re-construct the page of my dreams. Yes, I can be easily entertained.

<table width="100%" border="0" align="center" cellpadding="0" cellspacing="0">
<tr valign ="top" align="center">
<td width="11%"><b>Tonight<br></b><br><img src="/images/wtf/nshra50.jpg" width="55" height="58" alt="Scattered Showers Chance for Measurable Precipitation 50%" title="Scattered Showers Chance for Measurable Precipitation 50%" ><br>Scattered<br>Showers<br>Lo <font color="#0033CC">45 &deg;F</font></td><td width="11%"><b>Tuesday<br></b><br><img src="/images/wtf/shra50.jpg" width="55" height="58" alt="Scattered Showers Chance for Measurable Precipitation 50%" title="Scattered Showers Chance for Measurable Precipitation 50%" ><br>Scattered<br>Showers<br>Hi <font color="#FF0000">54 &deg;F</font></td><td width="11%"><b>Tuesday<br>Night</b><br><img src="/images/wtf/nshra30.jpg" width="55" height="58" alt="Scattered Showers Chance for Measurable Precipitation 30%" title="Scattered Showers Chance for Measurable Precipitation 30%" ><br>Scattered<br>Showers<br>Lo <font color="#0033CC">44 &deg;F</font></td><td width="11%"><b>Wednesday<br></b><br><img src="/images/wtf/bkn.jpg" width="55" height="58" alt="Partly Sunny" title="Partly Sunny" ><br>Partly<br>Sunny<br>Hi <font color="#FF0000">57 &deg;F</font></td><td width="11%"><b>Wednesday<br>Night</b><br><img src="/images/wtf/hi_nshwrs30.jpg" width="55" height="58" alt="Chance Showers Chance for Measurable Precipitation 30%" title="Chance Showers Chance for Measurable Precipitation 30%" ><br>Chance<br>Showers<br>Lo <font color="#0033CC">46 &deg;F</font></td><td width="11%"><b>Thursday<br></b><br><img src="/images/wtf/shra30.jpg" width="55" height="58" alt="Chance Showers Chance for Measurable Precipitation 30%" title="Chance Showers Chance for Measurable Precipitation 30%" ><br>Chance<br>Showers<br>Hi <font color="#FF0000">59 &deg;F</font></td><td width="11%"><b>Thursday<br>Night</b><br><img src="/images/wtf/nshra30.jpg" width="55" height="58" alt="Chance Showers Chance for Measurable Precipitation 30%" title="Chance Showers Chance for Measurable Precipitation 30%" ><br>Chance<br>Showers<br>Lo <font color="#0033CC">46 &deg;F</font></td><td width="11%"><b>Friday<br></b><br><img src="/images/wtf/shra.jpg" width="55" height="58" alt="Chance Showers" title="Chance Showers" ><br>Chance<br>Showers<br>Hi <font color="#FF0000">59 &deg;F</font></td><td width="11%"><b>Friday<br>Night</b><br><img src="/images/wtf/nshra.jpg" width="55" height="58" alt="Chance Showers" title="Chance Showers" ><br>Chance<br>Showers<br>Lo <font color="#0033CC">46 &deg;F</font></td></tr>
</table>

Snagging that out of the documents for 2-3 locations will get me what I want. It should look something like this, but the example here does not have any stylesheets applied, it’s a direct rip and mash.

Sample mashup, this was done manually. It at least proved the concept.

There are a couple of problems with that page though, it’s going to take up too much real estate on the final page. Here, it’s almost too large to view on my laptop’s main screen. So, some embedded CSS is in order. This hear overloads the td type, making any text found within anytd rendered at 80% of the normal size. This also overloads creates a style named headish that I is applied to the section titles:

<style>
.headish { 
  font-weight:bold; 
  background-color:#CCC; 
  font-size: 1.2em;}
td { font-size: 0.8em; }
</style>

The result of that very small change, gives me a smaller visual footprint, and formatting at little more pleasing to my sensibilities:

A little more hammering around in the stylesheet, and adding a CURRENT and High/Low temps forecast for the day. A little closer to the desired mockup. I still need to locate a suitable news feed to process:

A little closer to the desired mashup page.

PART 2 –>

Sea Lions at the Santa Cruz Beach Boardwalk Pier

Sea Lions! Tons of sea lions!. I’m sure that’s and underestimate.

Normally on the boardwalk you would see a few seals up under the main wharf, but it appears that they have invated the Stagnaro’s boat launch, and, well, see for yourself. It looks like the aftermath of some sort of frat party or Roman toga orgy.

What you used to find, a few stragglers under the wharf.
Now, it's a seal pile!
Marine mamals, everywhere!
It sort of makes you wonder, if they heeded the warning.
I was treated to some mamal aeorbatics.
Some made better choices than others, regarding their LZ.
This provides a little more perspective on the mass of blubber and fins.
This has nothing to do with sea lions, it's the street side of The Boardwalk